How to Build an AI Wait Time Estimator That Actually Works for Your Restaurant
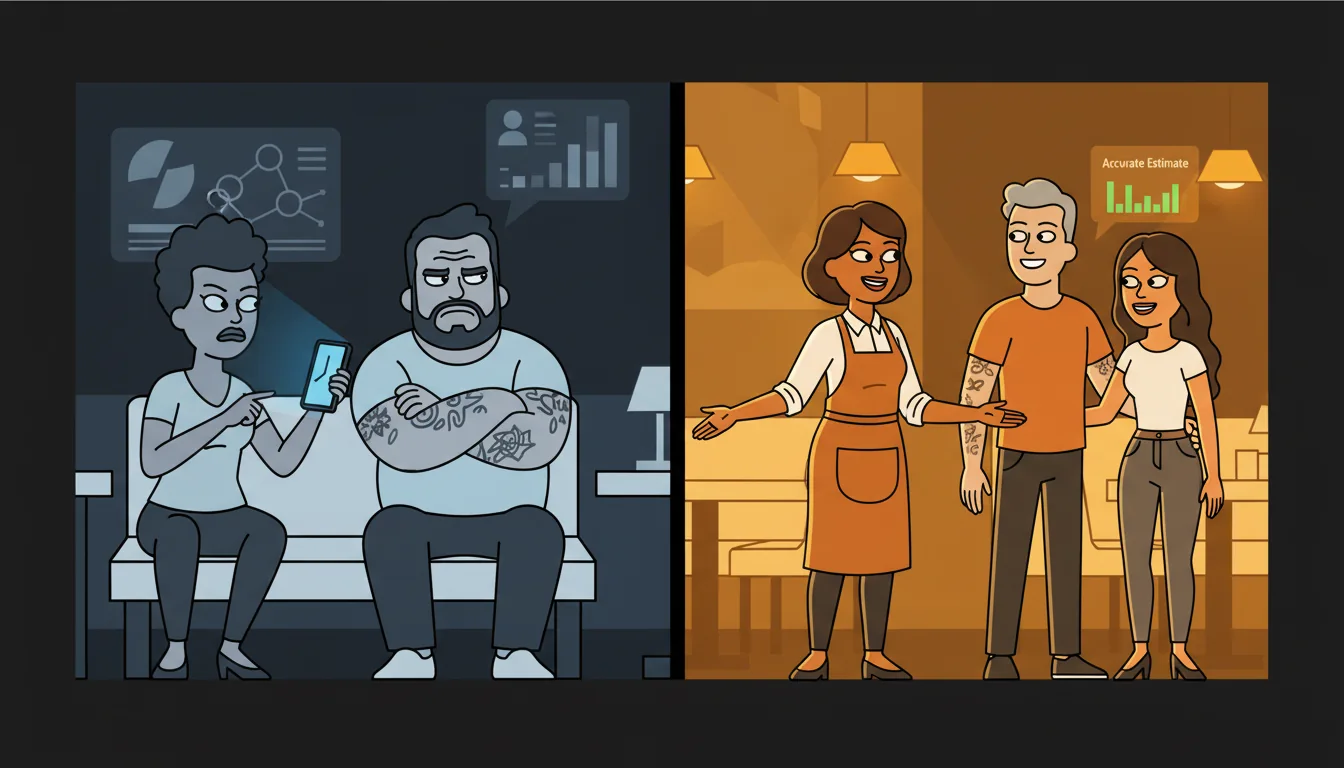
Every host has said it: "It'll be about 20 minutes." Every guest has thought it: "That's not 20 minutes." The wait time estimate is the most common lie in restaurants — not because hosts are dishonest, but because they have no data. They're guessing based on how busy the dining room looks, how many names are on the list, and a vague sense of how long the last party took. The guess is wrong more often than it's right, and the consequences are real: guests leave, post a bad review, or sit fuming for 40 minutes when they were told 20.
I've watched hosts give the same "20 minutes" estimate to three different parties, all with different party sizes, all at different points in the evening. The number wasn't based on anything — it was a default. A socially acceptable number that felt right. The problem is that "feels right" doesn't match reality, and the gap between the estimate and the actual wait is where guest satisfaction dies.
Building an accurate wait time estimator doesn't require expensive technology. It requires connecting data you already have — table turn times, kitchen ticket times, and real-time table status — into a model that updates as conditions change. Here's how to build one.
Step 1: Track Actual Table Turn Times — Know How Long Your Tables Actually Take
Before you build any model, you need to know how long a 2-top actually takes versus a 4-top versus a 6-top. Not your gut feeling — the actual numbers.
Pull data from your POS for the past 90 days. For each table, you need: party size, time seated, time the check was closed, and day of week. Most modern POS systems track this automatically. If yours doesn't, a simple manual tracking sheet at the host stand works — just log party size, time seated, and time cleared for every table for two weeks.
What you'll find will surprise you. A 2-top on a Tuesday lunch averages 35 minutes. A 4-top on a Saturday dinner averages 75 minutes. A 6-top with appetizers and dessert averages 105 minutes. These averages become the baseline for your wait time model.
But averages hide variance. A 2-top that orders just salads turns in 20 minutes. A 2-top that orders appetizers, entrees, and dessert takes 50 minutes. The model needs to account for this variance — which is where kitchen ticket data comes in.
Step 2: Monitor Kitchen Ticket Times — Your Turn Time Multiplier
The kitchen is the bottleneck for table turn time. A table doesn't turn until the food is delivered, eaten, and the check is closed. If your kitchen is running 25-minute ticket times on a busy Friday, every table's turn time extends by 25 minutes compared to a Tuesday when tickets run 12 minutes.
Pull average ticket times from your POS or kitchen display system. Break them down by shift (lunch vs. dinner), day of week, and item count per ticket. A 6-top ordering appetizers and entrees produces a longer ticket time than a 2-top with salads — and the turn time reflects that.
The key metrics to track:
- Average ticket time by day and shift. Friday dinner tickets take 22 minutes on average. Tuesday lunch tickets take 11 minutes. This tells you how fast tables will turn at different times.
- Ticket time by party size. Larger parties order more items, which extends kitchen time. A 6-top ticket takes 40% longer than a 2-top ticket on average.
- Ticket time variance. On a slammed Friday, ticket times spike 30 to 50% above average. The model needs to account for kitchen load, not just base ticket times.
Step 3: Build a Real-Time Wait Model — Connect the Variables
The wait time model combines four real-time data sources:
- Open tables. How many tables are currently empty? This is your supply side.
- Seated table elapsed time. How long has each occupied table been seated? Compare to the average turn time for that party size at that time of day. This predicts when they'll leave.
- Kitchen ticket queue. How many tickets are currently open? What's the current average ticket time? This predicts how fast new tables will get their food.
- Party size on the waitlist. How many people are waiting, and what are their party sizes? This is your demand side.
Here's a simplified example. You have 3 tables of 4 currently seated. Table 1 has been seated 60 minutes (average turn: 70 minutes — likely opening in 10 minutes). Table 2 has been seated 30 minutes (likely opening in 40 minutes). Table 3 has been seated 45 minutes (likely opening in 25 minutes). You have 2 parties of 4 on the waitlist. The first party gets Table 1 in about 10 minutes. The second party gets Table 3 in about 25 minutes. A new party of 4 joining the waitlist gets an estimate of 40 minutes — when Table 2 opens.
This is the basic model. It gets more accurate as you add variables: kitchen load (if tickets are running long, turn times extend), server sections (a table might be open but the assigned server is at capacity), and reservation timing (a reservation at 7:30 blocks a table from being seated at 7:15).
Step 4: Add Text Updates — Tell Guests When the Estimate Changes
The biggest complaint about restaurant wait times isn't the wait itself — it's the silence. A guest who was told 20 minutes and has been waiting 30 minutes with no update is far more frustrated than a guest who was told 40 minutes and waited 40 minutes. The expectation was set. The communication failed.
Automated text updates fix this. When a guest joins the waitlist, they provide a phone number. The system sends them a text when their table is estimated to be ready. If the estimate changes — a table lingered, the kitchen slowed down, a large party just left — the system sends an updated text.
"Your table will be ready in about 10 minutes" beats radio silence every time. Even when the news is bad ("Your wait is now estimated at 35 minutes instead of 25"), communication builds trust. The guest knows they haven't been forgotten.
The text system also frees the host from playing phone tag. Instead of calling out names over a crowded lobby, the system notifies guests directly. The host focuses on seating, not paging.
For restaurants that use a waitlist platform (Yelp Waitlist, Nowait, Waitwhile), texting is often built in. For others, a simple integration with an SMS API (Twilio, MessageBird) handles the notifications. The cost is minimal — a few cents per text — and the impact on guest satisfaction is significant.
Step 5: Handle Walk-ins and Reservations Differently — Two Models, One System
Walk-ins and reservations have fundamentally different wait dynamics, and your model needs to treat them separately.
Walk-ins have variable waits based on current demand and table availability. The model described above handles this — it predicts when tables will open based on seated party elapsed times and kitchen load. Walk-in estimates update in real time as conditions change.
Reservations should have near-zero wait time. A guest who reserved a table for 7:30 expects to be seated at 7:30. If they're waiting 15 minutes past their reservation, something is wrong — either the previous table lingered, the reservation was overbooked, or the table wasn't prepped in time.
The system should track reservation compliance separately. If your reservation wait time averages more than 5 minutes, you have a problem to fix — not a model to build. Common fixes: add a 15-minute buffer between reservations, limit overbooking to 10%, or assign a dedicated staff member to manage reservation timing.
For mixed operations (both walk-ins and reservations), the model needs to account for reservations when predicting walk-in wait times. A table that's open now but reserved for 7:30 isn't available for a walk-in at 7:15. The reservation blocks the table.
Step 6: Close the Feedback Loop — Compare Predicted vs. Actual
After every seating, the system should compare the predicted wait time to the actual wait time. If you predicted 20 minutes and the guest waited 35 minutes, that's a miss — and the model needs to learn from it.
Track three metrics weekly:
- Average absolute error. How far off are your estimates, in minutes? Target: under 5 minutes average.
- Overestimate vs. underestimate ratio. Are you consistently optimistic (telling guests less time than it takes) or conservative (padding the estimate)? A slight conservative bias is better — guests are pleasantly surprised when they're seated early.
- Error by party size and time of day. Are your 6-top estimates less accurate than your 2-top estimates? Are dinner estimates less accurate than lunch? This tells you where the model needs more data or different variables.
The feedback loop also catches systemic issues. If your Friday dinner estimates are consistently 15 minutes short, that tells you your kitchen ticket time model for Friday dinner needs adjustment — maybe the kitchen load multiplier isn't aggressive enough.
What Happens After You Build an Accurate Wait Time Estimator?
The most visible change is guest satisfaction. Guests who receive accurate estimates and proactive updates rate their experience significantly higher — even if the wait was long. The frustration isn't about waiting. It's about not knowing.
The second change is reduced walkaways. When a guest hears "45 minutes" and that number is accurate, they make an informed decision: wait or leave. When they hear "20 minutes" and wait 40, they leave angry — and they don't come back. Accurate estimates convert uncertain walkaways into informed decisions.
The third change is operational insight. The wait time model reveals patterns you can't see any other way: which server sections turn fastest, which menu items extend turn times, which nights have the worst wait time variance. That data informs staffing, menu design, and reservation policies.
Want to See Where Your Restaurant's Biggest AI Opportunities Are?
If you're tired of the "20 minutes" default and want to give your guests real answers, take our free AI Readiness Quiz. It takes 2 minutes and shows you exactly where your restaurant has the biggest opportunities for automation and data-driven decision making.
We built this quiz after seeing the same pattern across dozens of restaurants: great food, great atmosphere, and a host stand that runs on vibes instead of data. The quiz shows you where connecting your existing systems — POS, waitlist, kitchen display — can transform the guest experience.
Next step
Choose the next practical step for your restaurant.
Check your restaurant's AI readiness or use the SWOT path to identify the most useful operational opportunities.
Keep reading
Related posts
More practical guidance for restaurant operators who want less busywork and better follow-through.
How to Automate Health Code Compliance Tracking
Your temp log says the walk-in was 38 degrees at 6 AM. Your dishwasher says he checked it. The health inspector finds it at 46 degrees at 10 AM. Nobody knows when it actually rose - or if it was ever
How to Set Up AI-Powered Invoice Processing for Your Restaurant
Your Sysco invoice came in on Tuesday. It's now Friday. The paper is sitting under a stack of takeout menus and a half-eaten bag of chips on the manager's desk. Nobody has entered it into the system.
How to Build an AI-Powered Call-Off Response System
It's 4 PM on a Friday. Your best server just texted: "Hey, not feeling well, can't make it tonight." You have 90 minutes before the dinner rush. Your floor plan was already tight - now you're a body s