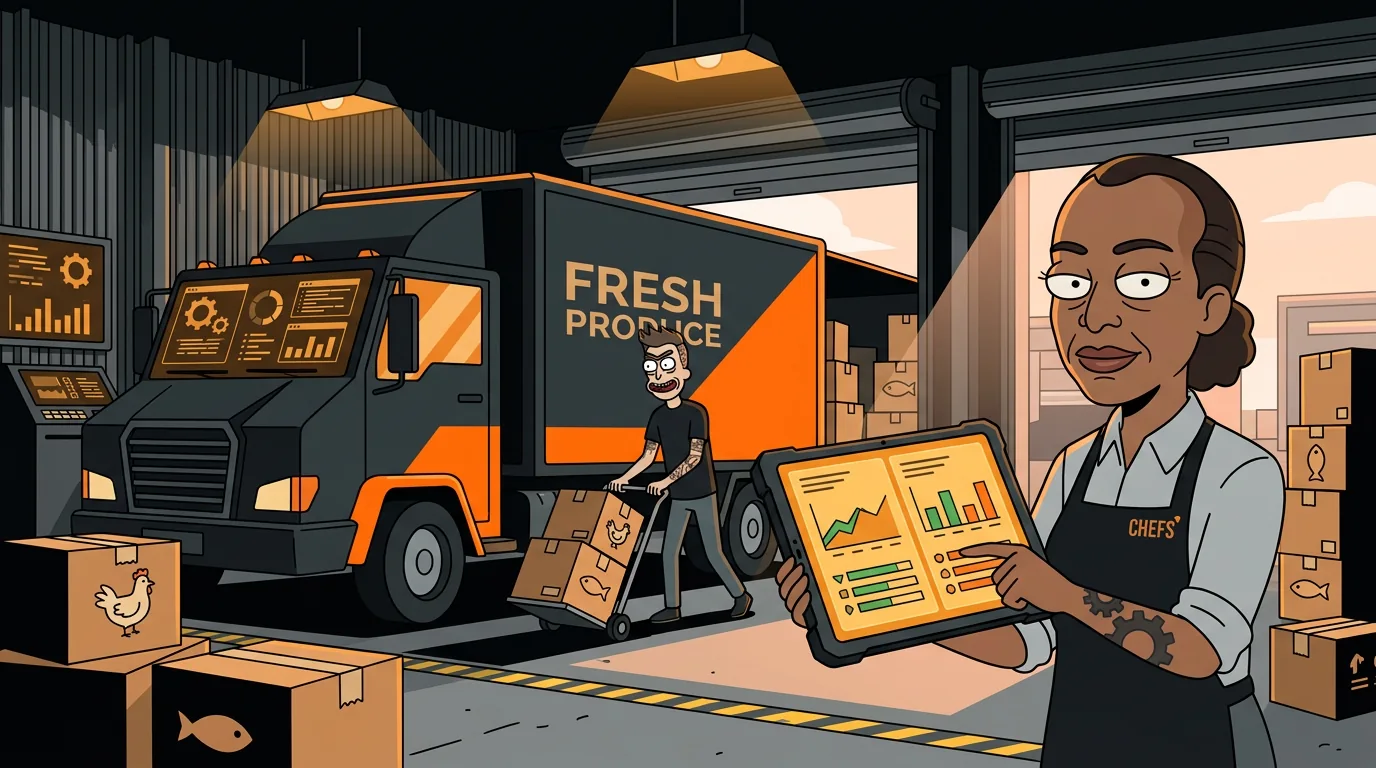
How to Build a Vendor Price Comparison Dashboard with AI
Your Sysco rep just sent the monthly invoice. Chicken breast is up 12%. You call your US Foods rep and find out they're 8% cheaper on the same product. You've been overpaying for three months because nobody compared the two.
This happens in almost every restaurant. You order from the same vendors because switching is a hassle, because you've always done it that way, because who has time to comparison shop when you're running a kitchen? The answer: you don't have to do it manually anymore. AI-powered invoice scanning can build a vendor comparison dashboard in about 20 minutes per week.
Food cost variance of just 2% means $40,000 in annual profit for a mid-size restaurant doing $80,000 a week in revenue. Here's how to track vendor prices systematically without spending your entire Sunday on spreadsheets.
Why Don't Restaurants Compare Vendor Prices?
The short answer: it's tedious. The long answer involves three problems that stack on top of each other.
Problem 1: Different units. Sysco sells chicken breast in 40-pound cases. US Foods sells the same product in 10-pound cases. Your local distributor sells by the pound. Comparing prices requires converting everything to a common unit - price per pound, price per ounce, price per unit. Nobody wants to do that math for 200 line items.
Problem 2: Inconsistent product names. One vendor calls it "Chicken Breast Boneless Skinless IVP" and another calls it "IB Chicken B/S Breast." Same product, different name. Matching items across vendors is a manual, error-prone process.
Problem 3: No centralized data. Your Sysco invoices are in one email thread. US Foods sends PDFs. Your local distributor faxes theirs (yes, some still fax). There's no single place to see all your vendor prices side by side.
AI solves all three problems. Invoice scanning tools can read PDFs and images, normalize product names, convert units, and build comparison tables automatically.
What Tools Do You Need to Build This?
You don't need an expensive enterprise platform. Here's what works at different budget levels:
- Google Sheets + Google Lens (phone camera OCR)
- Take a photo of each invoice, extract text, paste into Sheets
- Build your own comparison formulas
- Time investment: 2-3 hours/week
- Plate IQ or MarketMan basic plan
- Upload invoice photos or PDFs
- Automatic line item extraction and categorization
- Time investment: 30 minutes/week
- MarginEdge or Restaurant365
- Full invoice scanning + food cost tracking + vendor comparison
- Integrates with your POS for real-time food cost updates
- Time investment: 15 minutes/week
How Do You Normalize Data Across Vendors?
Once you've scanned invoices from your top three vendors, you need to match products and convert units. This is the step most people skip, and it's why their comparisons are wrong.
Step 1: Match product names. Create a master product list. Map each vendor's product name to your standard name. For example:
- Sysco: "CHICKEN BREAST B/S IVP 8-10 OZ" → Your name: "Chicken Breast 8-10oz"
- US Foods: "IB CHICKEN B/S BREAST RANDOM" → Your name: "Chicken Breast 8-10oz"
- Local: "Boneless Chicken Breast" → Your name: "Chicken Breast 8-10oz"
Step 2: Convert to common units. Calculate price per pound for every item. The formula: (Case price / Case weight in pounds) = Price per pound.
If Sysco sells a 40-pound case for $120, that's $3.00/pound. If US Foods sells a 10-pound case for $34, that's $3.40/pound. Same product, 13% price difference.
Step 3: Account for quality differences. Not all chicken breast is the same. Grade, processing level, and brand matter. If one vendor is significantly cheaper, check whether the product quality matches. A 10% savings on a lower-grade protein might not be worth it if your customers notice.
How Do You Build the Actual Comparison Dashboard?
Here's the structure that works. You need four columns minimum:
| Product | Vendor A (Price/lb) | Vendor B (Price/lb) | Vendor C (Price/lb) | Best Price | Savings | |---------|--------------------|--------------------|--------------------|-----------|---------| | Chicken Breast | $3.00 | $3.40 | $3.15 | Vendor A | $0.40/lb | | Ground Beef 80/20 | $4.20 | $3.95 | $4.10 | Vendor B | $0.25/lb | | All-Purpose Flour | $0.45 | $0.42 | $0.48 | Vendor B | $0.06/lb |
Add conditional formatting to highlight items where the price difference exceeds 10%. Those are your switch candidates.
- Upload new invoices (Monday morning, 15 minutes)
- Review the comparison table (5 minutes)
- Flag items with >10% variance (automatic if using a tool)
- Decide: switch vendors, negotiate with current vendor, or keep for quality/relationship reasons
- Track monthly savings
What Happens After You Start Comparing?
The first month is eye-opening. Most restaurants discover they're overpaying on 15-25% of their products by at least 10%. For a restaurant spending $15,000/week on food, that's $1,500-$3,750 in potential monthly savings.
One operator tracked vendor prices for six months and discovered their local distributor was consistently 15-20% cheaper on produce but 10-15% more expensive on proteins. They split their ordering: produce from the local guy, proteins from Sysco. Net savings: $2,400/month.
How Does This Connect to Menu Pricing?
Vendor price tracking and menu pricing are two sides of the same coin. When chicken breast goes up 12%, your chicken parm margin drops. If you're not tracking vendor prices, you don't notice until you look at your P&L three months later and wonder why your food cost jumped from 31% to 34%.
The connection works both ways:
- Vendor prices inform menu prices: If your food cost on a menu item exceeds your target, you either raise the price, reduce the portion, or find a cheaper supplier.
- Menu data informs vendor decisions: If chicken parm is your best-selling item and chicken prices spike, finding a cheaper chicken supplier has a bigger impact than saving 5% on flour.
What Should You Do Next?
Start simple. Pick your top 10 most expensive ingredients - the ones that make up 60-70% of your food cost. Collect invoices from your top two vendors for those items. Build a comparison in a spreadsheet. See what the numbers say.
If you want help figuring out which AI tools fit your operation - your vendor mix, your volume, your budget - take our 2-minute AI Readiness Quiz. It maps your current setup to the right tools and shows you where the biggest savings hide.
Next step
Choose the next practical step for your restaurant.
Check your restaurant's AI readiness or use the SWOT path to identify the most useful operational opportunities.
Keep reading
Related posts
More practical guidance for restaurant operators who want less busywork and better follow-through.
How to Use AI to Handle Shift Call-Outs Without Manager Scrambling
It's 10 AM on a Saturday. Your 6 PM line cook just texted "can't make it." You have 8 hours and 30 contacts to call. Here's how an AI agent handles this in under 2 minutes - without you touching your
How to Build an AI Layer on Top of Toast POS
Your Toast POS captures every transaction, every labor hour, every menu item sold. It gives you charts. What it doesn't give you is a recommendation. Here's how to build the layer that turns your data
How to Use AI to Detect Overtime Before It Happens in Your Restaurant
You just ran payroll. Three servers hit overtime last week. One racked up 12 hours of time-and-a-half. You didn't know until the damage was already done.