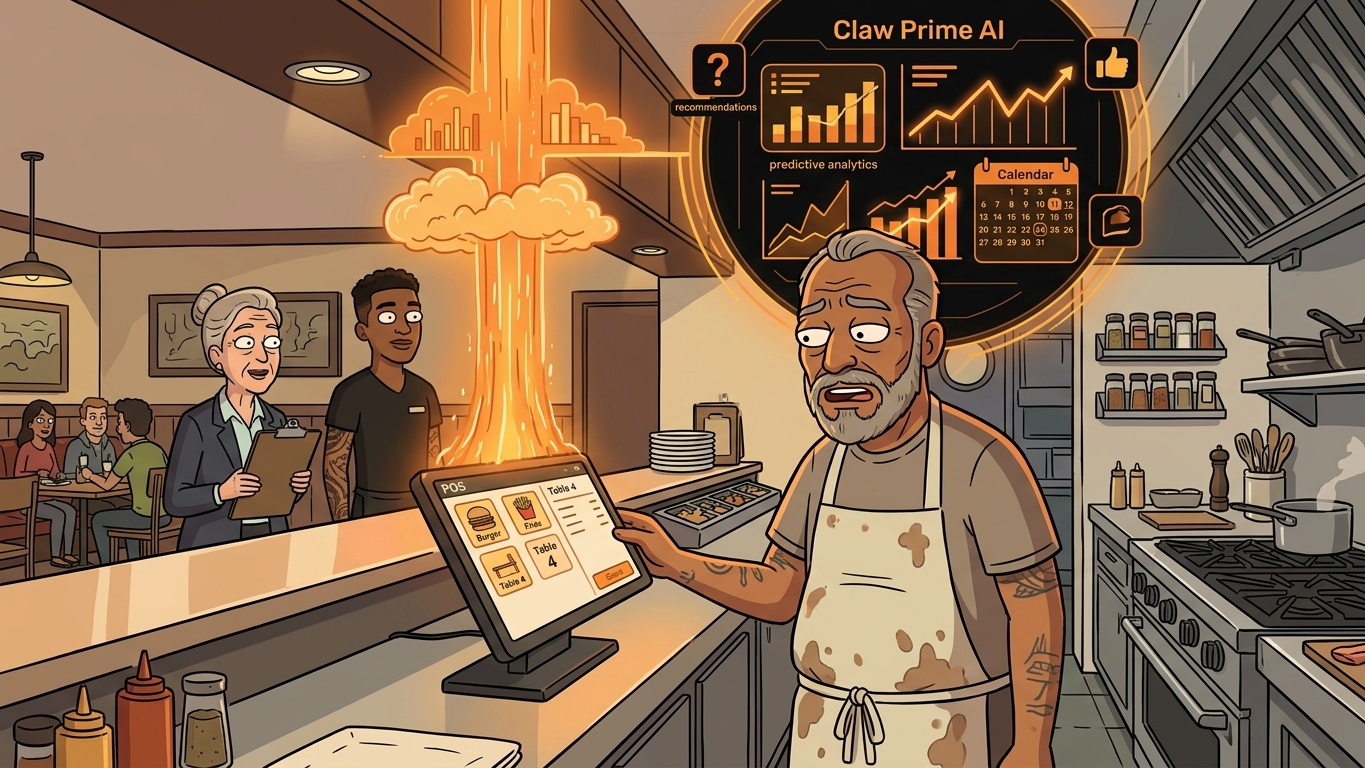
How to Build an AI Layer on Top of Toast POS
Your Toast POS captures every transaction, every labor hour, every menu item sold. It gives you charts. What it doesn't give you is a recommendation. Here's how to build the layer that turns your data into decisions.
You walk in at 6 AM. Yesterday's numbers look off - labor cost crept up 3%, food cost spiked on Tuesday, and your ticket average dipped for the third week in a row. Toast shows you the charts. The colors are pretty. But nowhere in those dashboards does it say "your Tuesday dinner crew had an extra person on the line because someone swapped shifts without approval" or "your salmon dish is dragging your margins because the vendor raised prices 18% and you never updated your menu pricing."
That's the gap. Toast is a solid POS - it processes transactions cleanly, tracks labor hours, and gives you exportable data. But it doesn't analyze. It doesn't recommend. It doesn't tell you what to DO with the data it collects. You're still the one staring at spreadsheets at 11 PM trying to figure out why last week felt harder than the one before.
An estimated 87% of restaurant leaders are investing in AI this year according to industry surveys. Most of them have POS data they're not using. The ones pulling ahead aren't buying fancier POS systems - they're building an intelligence layer on top of what they already have.
What Data Does Toast Actually Give You Access To?
Toast offers a public API through their developer portal. The API has four main data categories you need for an AI layer:
Orders API - Every transaction with timestamps, item details, modifiers, discounts, and payment methods. This is your sales backbone.
Labor API - Clock-ins, clock-outs, scheduled shifts, overtime flags, role assignments, and pay rates. This is your cost backbone.
Menu API - Item names, categories, pricing, modifiers, and availability status. This connects your sales data to what you're actually selling.
Payments API - Transaction amounts, tip data, payment methods, and refund history. This tells you how money actually flows.
Access is straightforward. Toast uses OAuth 2.0 authentication. You create a developer account at developers.toasttab.com, register your restaurant, and get API credentials. The Easy tier (free) gives you read access to Orders, Labor, Menu, and Payments - everything you need.
One important note: Toast API access requires either a developer account linked to a live Toast restaurant, or a sandbox account for testing. If you're not technical, you'll need someone who can handle the OAuth flow and make API calls. But the data is there, waiting.
How Do You Pull Toast Data Into a Usable Format?
The raw API gives you JSON responses. You need to pull that into a structured format your AI layer can analyze. Here's the approach:
Step 1: Set up a daily data pull. Schedule a script to hit the Toast API every morning at 5 AM (before you open) and pull the previous day's data. Store it in a JSON file or a simple database like SQLite. You want: yesterday's orders, labor hours, and any menu changes.
Step 2: Normalize the data. Toast returns nested JSON with restaurant-specific IDs. Flatten it into clean tables: one row per order, one row per labor clock-in, one row per menu item sold. Add calculated fields: labor cost per hour, food cost percentage, ticket average, items per ticket.
Step 3: Build a rolling baseline. Don't just look at yesterday - calculate 7-day and 30-day averages for every metric. This is your baseline. Without a baseline, you can't detect anomalies. Your Tuesday labor cost of 32% means nothing until you know your Tuesday average is 27%.
Step 4: Store historical data. Keep at least 90 days of daily data. Seasonal patterns, day-of-week trends, and menu cycle effects only become visible with enough history. A rolling 90-day window catches most patterns.
The whole data pipeline takes about 2-4 hours to set up if you're comfortable with Python or Node.js. If you're not, this is a one-time developer expense - maybe $200-500 for someone to build and deploy it.
How Do You Detect Cost Anomalies Automatically?
This is where the AI layer earns its keep. Anomaly detection is the difference between "here's a chart" and "here's a problem."
What Do AI-Generated Recommendations Look Like?
Raw anomalies are useful, but natural-language recommendations are what make this layer worth building. Here's what the output should sound like:
"Your Tuesday labor cost spiked 4% this week. Three employees clocked in 15-20 minutes early, adding $187 in unplanned labor. Your Tuesday dinner crew had 6 people scheduled but your ticket volume only required 5 based on your last 8 Tuesdays. Recommendation: adjust Tuesday dinner schedule to 5 people and enforce clock-in windows of plus or minus 5 minutes."
"Your salmon entree food cost jumped from 31% to 38% this month. Your vendor increased salmon price from $8.20/lb to $9.65/lb on June 15. You haven't adjusted your menu price ($24.95) since January. At the new cost, your salmon margin dropped from 69% to 61%. Recommendation: increase menu price to $26.95 or substitute with a lower-cost fish option."
"Your ticket average dropped $4.50 over the last 3 weeks. The decline is concentrated in the dinner daypart. Your appetizer attachment rate (apps per ticket) dropped from 0.4 to 0.2 after your 'Half-Price Apps Before 6 PM' promotion ended on June 1. Recommendation: run a targeted appetizer promotion or add a suggested appetizer to your POS checkout flow."
These aren't hypothetical. This is exactly what happens when you connect Toast's data to a structured analysis layer. The POS already collects everything - you just need to ask the right questions.
How Do You Get Reports on Your Phone Instead of a Dashboard?
Nobody has time to check another dashboard. The whole point of an AI layer is that it comes to you.
Option 1: Daily text message summary. Every morning at 7 AM, send yourself a text with yesterday's key metrics and any anomalies. Format: "Yesterday: $4,230 sales, 28% labor (normal), 34% food cost (+3% flag). Alert: salmon margin dropped - vendor price increase on 6/15."
Option 2: Weekly email digest. Every Monday morning, send a summary of the week: total sales, labor trend, food cost trend, top 3 anomalies, and recommended actions. This is your Monday morning briefing without the meeting.
Option 3: Alert-only mode. Only message when something is outside baseline. No news is good news. You get a text only when labor cost exceeds your threshold, food cost spikes, or ticket average drops below your floor.
All three options use the same data pipeline - the only difference is the delivery trigger. A simple cron job (scheduled task) runs the analysis and sends the report. You can set this up with Twilio for SMS ($0.0079 per message) or any email API.
For restaurant owners, alert-only mode works best. You don't need a daily report telling you everything is fine. You need a message when something is wrong - with enough context to take action immediately.
How Do You Add Menu Engineering Analysis?
Menu engineering is the hidden profit lever most restaurants ignore. Your Toast data already has everything you need to do it automatically.
- Stars (high popularity, high profit) - promote these, never remove them
- Plowhorses (high popularity, low profit) - reprice or reduce portion cost
- Puzzles (low popularity, high profit) - better marketing or server recommendations
- Dogs (low popularity, low profit) - consider removing or reimagining
This analysis takes about 30 minutes to set up once your data pipeline is running. It's the single highest-ROI addition to your AI layer because it directly impacts your menu pricing strategy.
What Happens After You Deploy This Layer?
The first week, you'll probably find 3-5 anomalies you never knew about. An employee clocking in early every Tuesday. A menu item whose vendor price changed two months ago. A daypart where your ticket average is tanking because nobody's upselling desserts.
After 30 days, you'll have a clear picture of your cost patterns by day of week, by daypart, by menu category. You'll stop being surprised by your P&L because you've already seen the daily signals.
After 90 days, the ROI becomes concrete. Restaurant owners who build this layer typically report 2-4% improvement in food cost and 1-3% improvement in labor cost. On a restaurant doing $15,000/week, that's $150-450/week back in your pocket - $600-1,800/month.
The real value isn't the money. It's the peace of mind. You stop wondering "is something wrong?" every time you open the POS. You know. The system tells you. And you fix it before it becomes a problem on your P&L.
FAQ
How much does it cost to build an AI layer on Toast POS?
If you build it yourself (Python/Node.js + SQLite + Twilio for SMS), the ongoing cost is about $5-15/month for hosting and messaging. If you hire a developer to build the initial pipeline, expect $500-1,500 for the setup. The Toast API itself is free at the Easy tier.
Do I need to be technical to set this up?
You need basic coding ability or a developer who can work with REST APIs. The Toast API documentation is solid, and the data pipeline is straightforward. If you can write a Python script that calls an API and saves JSON, you can build this.
Can I do this with other POS systems besides Toast?
Yes. Square, Clover, Lightspeed, and SpotOn all have APIs with similar data access. The approach is the same - pull sales, labor, and menu data, build baselines, detect anomalies, generate recommendations. Toast is one of the more API-friendly options, but the pattern works with any POS that exposes transaction and labor data.
What if my Toast API access gets revoked?
Toast controls API access through their developer portal. If you're on a valid Toast subscription and following their terms, access is stable. The main risk is if you change Toast plans or if Toast changes their API policies. Always store your historical data independently so you're not dependent on API access for trend analysis.
Want to see what AI could do with your POS data? Take our free 2-minute quiz to find your restaurant's biggest automation opportunities: clawprime.ai/quiz
Next step
Choose the next practical step for your restaurant.
Check your restaurant's AI readiness or use the SWOT path to identify the most useful operational opportunities.
Keep reading
Related posts
More practical guidance for restaurant operators who want less busywork and better follow-through.
How to Use AI to Handle Shift Call-Outs Without Manager Scrambling
It's 10 AM on a Saturday. Your 6 PM line cook just texted "can't make it." You have 8 hours and 30 contacts to call. Here's how an AI agent handles this in under 2 minutes - without you touching your
How to Use AI to Detect Overtime Before It Happens in Your Restaurant
You just ran payroll. Three servers hit overtime last week. One racked up 12 hours of time-and-a-half. You didn't know until the damage was already done.
What Taco Bell's 900-Location Voice AI Expansion Means for Your Restaurant
Taco Bell just scaled voice AI to 900 drive-thru locations. Omilia is powering it. Five major outlets covered it this week. And every independent restaurant owner I know had the same reaction: "Great.