
How to Automate Menu Optimization with Data for Your Restaurant
You're staring at your menu after close, wondering why the salmon dish you added three months ago is barely moving. Your gut told you it would be a hit. Your food cost says otherwise. Meanwhile, the chicken sandwich nobody thought twice about is outselling everything by 3-to-1, and you haven't touched its price since you opened.
This is how most restaurants manage their menus. Gut feeling, copy what works elsewhere, maybe adjust prices when food costs spike. The National Restaurant Association reports that 62% of operators cite food cost management as their top challenge, yet fewer than 20% use any kind of data-driven framework for menu decisions. That's a lot of money left on the table - and it adds up fast.
Here's the step-by-step framework for turning your menu from a guessing game into a margin machine. No expensive software required. Just your POS data, a spreadsheet, and about two hours a week.
What Is a Margin x Velocity Matrix and Why Should You Care?
A margin x velocity matrix is a simple grid that plots every menu item by two numbers: how much profit you make per item (margin) and how many you sell per week (velocity). It's the single most useful tool for menu optimization because it shows you exactly where your money comes from and where it leaks.
The matrix has four quadrants:
| Quadrant | Margin | Velocity | What It Means | Action | |----------|--------|----------|---------------|--------| | Stars | High | High | Your money makers | Protect these. Never 86 them. | | Puzzles | High | Low | Good margins, nobody orders them | Promote, reposition, or rename | | Plow Horses | Low | High | Popular but barely profitable | Raise price or reduce portion cost | | Dogs | Low | Low | Losing money and nobody wants them | Cut them. Today. |
Most restaurants have 60-70% of their revenue coming from Stars and Plow Horses. The real opportunity is in Puzzles - items with solid margins that just need a push - and in fixing Plow Horses that are popular but bleeding profit.
According to Toast's 2026 IQ margin protection data, operators who actively manage menu pricing based on item-level data see 15-20% higher margins than those who set prices once and forget them. That's not a rounding error - that's $40,000-$80,000 a year for a mid-size restaurant.
How Do You Pull the Data You Need from Your POS?
Every POS system tracks item-level sales. Most of them track it well. The problem is nobody looks at it.
Here's what you need for each menu item over the past 90 days:
- Units sold per week - your velocity number
- Revenue per item - menu price x units sold
- Food cost per item - what it actually costs to make (not the recipe card from two years ago)
If you want to automate this step, tools like MarketMan, BlueCart, or even a simple Google Sheets formula connected to your POS export can update food costs weekly. The point is: use real numbers, not estimates.
How Do You Build the Matrix Once You Have the Data?
Once you have 90 days of item-level data, building the matrix takes about 30 minutes. Here's the exact process:
Step 1: Calculate average weekly velocity for each item. Take total units sold over 90 days and divide by 13 (weeks). This smooths out seasonal bumps.
Step 2: Calculate actual food cost percentage for each item. (Actual food cost / Menu price) x 100 = Food cost %. Your target depends on your restaurant type:
- Full service: 28-35%
- Fast casual: 25-30%
- QSR: 22-28%
Step 4: Plot each item on the matrix. Draw a 2x2 grid. X-axis = velocity (low to high). Y-axis = margin (low to high). Put each item in its quadrant.
Step 5: Identify your action items.
- Stars: Protect. Never run out. Keep quality consistent.
- Puzzles: Test promotions, server recommendations, menu positioning (top right of the menu gets the most eyes).
- Plow Horses: Test a $1-2 price increase. Most customers won't notice. If you sell 200 Plow Horse items per week and raise price by $1.50, that's $1,200/month straight to your bottom line.
- Dogs: Remove them. Every menu slot has an opportunity cost. A Dog taking up space could be a new Star.
How Do You Set Up Automated Weekly Data Pulls?
Manually pulling POS reports every week works, but it's the kind of task that gets skipped when you're busy - which is always. Here's how to automate it:
Option 1: POS API + Google Sheets (free, 2-hour setup)
If your POS has an API (Square, Toast, Lightspeed all do), you can set up a Google Sheet that pulls item sales data automatically. Square's API is the most accessible - there are free templates available that connect via Google Apps Script.
The setup: connect your Square account to a Google Sheet, set it to refresh daily, and build your matrix formulas in a second tab. Every Monday, the sheet updates with last week's numbers. You just review the matrix and make decisions.
Option 2: Export + Zapier ($20/month, 30-minute setup)
Set up a Zapier automation that triggers when your POS generates a weekly report. It exports the data, formats it, and drops it into your spreadsheet or dashboard. More reliable than manual exports, less technical than API integration.
Option 3: Restaurant analytics platform ($50-200/month)
Tools like MarginEdge, Restaurant365, or Plate IQ do this automatically and add features like invoice scanning, recipe costing, and trend alerts. Worth it if you're running multiple locations. For a single location, the free options usually suffice.
The key is consistency. A matrix you update weekly is infinitely more useful than a perfect matrix you build once and forget.
What Happens When You Actually Use This Data?
Restaurants that switch from gut-feel menu management to data-driven optimization typically see results within 30-60 days. Here's what the timeline looks like:
One operator I know ran this exact process and discovered their highest-margin item was a side dish nobody promoted. They moved it to a prominent menu position, trained servers to recommend it, and it went from selling 30/week to 120/week. That single change added $1,800/month in profit.
How Does AI Make This Easier?
Everything I described above can be done manually. It takes about 2-3 hours per week to maintain. But AI tools can compress that to 20 minutes:
- Automated food cost tracking: Tools like MarketMan or Plate IQ scan your invoices and update food costs in real time. No more manually checking Sysco prices.
- Competitor pricing analysis: AI can scrape local competitor menus and show you where your prices are above or below market. If your burger is $3 more than every similar restaurant in a 5-mile radius, you need to know that.
- Seasonal trend prediction: AI can analyze your historical sales data and predict when items will peak or dip. If your soup sales always spike in October, you can plan inventory and promotions accordingly.
- Menu engineering recommendations: Some tools will actually suggest which items to promote, reprice, or remove based on your data patterns.
What Should You Do Next?
Start with the matrix. Pull 90 days of POS data this week. Build the grid. See where your money actually comes from. It'll take one afternoon and it might change how you think about your entire menu.
If you want help figuring out which AI tools fit your specific setup - your POS system, your menu size, your budget - take our 2-minute AI Readiness Quiz. It'll show you exactly where automation makes sense for your restaurant and where it doesn't.
Next step
Choose the next practical step for your restaurant.
Check your restaurant's AI readiness or use the SWOT path to identify the most useful operational opportunities.
Keep reading
Related posts
More practical guidance for restaurant operators who want less busywork and better follow-through.
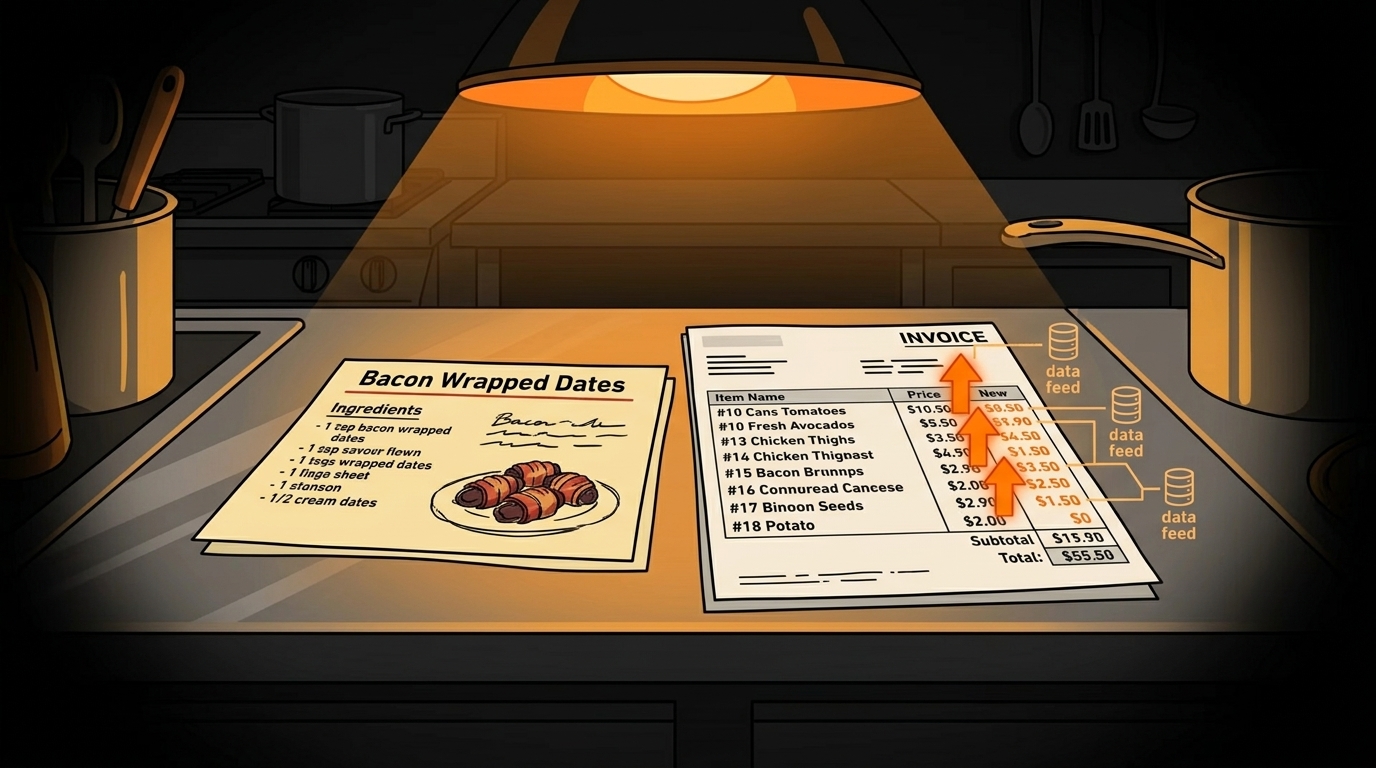
How to Automate Recipe Costing Updates When Ingredients Change Price
Your chicken parm recipe card says it costs $4.20 to make. Your last Sysco invoice says chicken breast went up 18%. You're actually losing $0.75 per plate and you won't know until you do the math - wh
How to Use AI to Handle Shift Call-Outs Without Manager Scrambling
It's 10 AM on a Saturday. Your 6 PM line cook just texted "can't make it." You have 8 hours and 30 contacts to call. Here's how an AI agent handles this in under 2 minutes - without you touching your
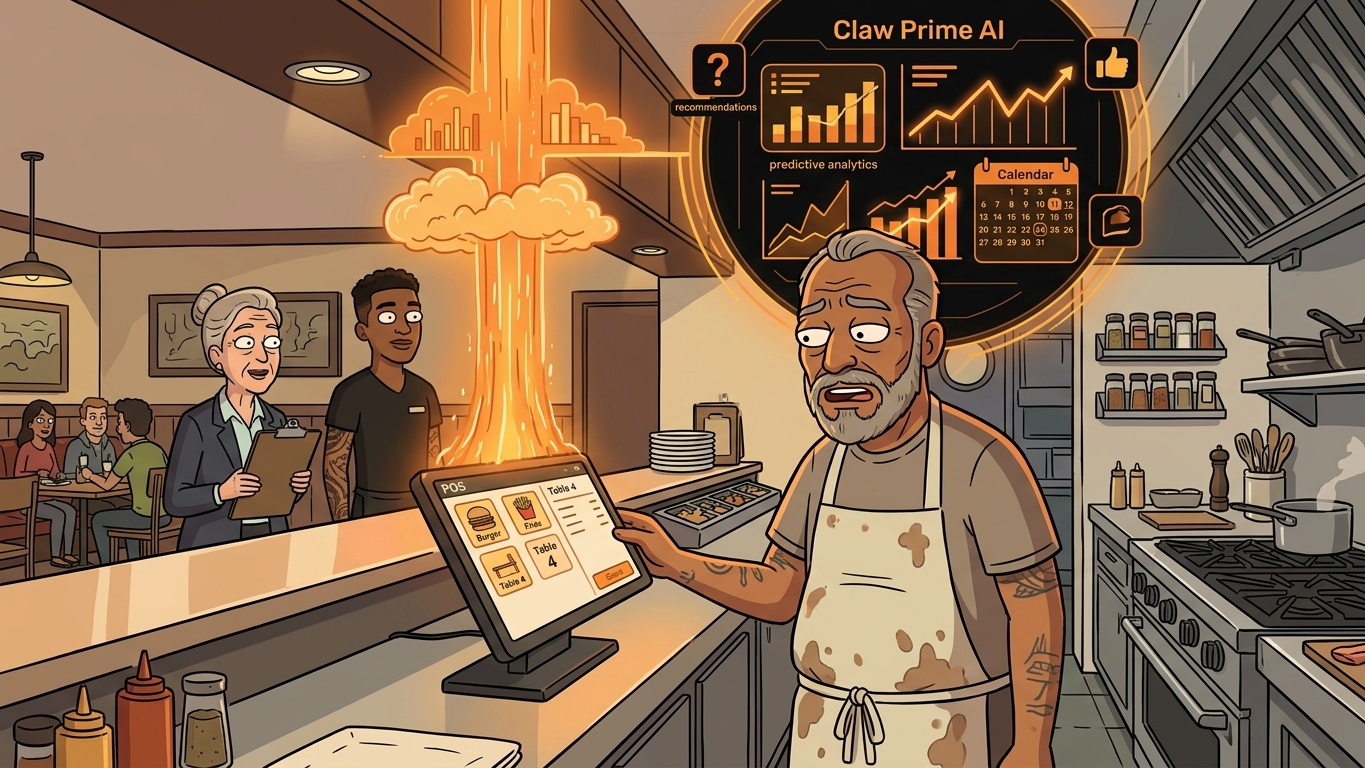
How to Build an AI Layer on Top of Toast POS
Your Toast POS captures every transaction, every labor hour, every menu item sold. It gives you charts. What it doesn't give you is a recommendation. Here's how to build the layer that turns your data